جستجو در تالارهای گفتگو
در حال نمایش نتایج برای برچسب های 'chart'.
2 نتیجه پیدا شد
-
سلام من برای اینکه یک آرایه از داده ها رو در qml نمایش بدم از ChartView و LineSeries استفاده می کنم و دستور append رو برای LineSeries در تایمر فراخوانی می کنم. میخوام وقتی یک بار عرض صفحه پیمایش شد، برای اینکه real time بودن گراف نشون داده بشه، یک eraser تعریف کنم که هر بار چند پیکسل از داده های جلوی خط رو حذف کنه و گراف رو بروز رسانی کنه. با تعریف دو LineSeries به نتیجه دلخواه نمی رسم ، میخواستم بپرسم کسی تجربه این در این زمینه داره که به اشتراک بگذاره؟ Rectangle { id: myRect width: 600 height: 400 anchors.centerIn: parent LinearGradient { anchors.fill: parent } ChartView { id: chartView anchors.centerIn: parent width: 600 height: 400 backgroundColor: "transparent" title: "My Graph" titleColor: Qt.rgba(.5,.5,.5,1) titleFont.pointSize:10 anchors.fill: parent antialiasing: true anchors { fill: parent; margins: 5 } margins { right: 0; bottom: 0; left: 0; top: 0 } Component.onCompleted: { axisX(lineSeries).visible = false axisY(lineSeries).visible = false } Rectangle { id: rec height:parent.height x: 30 y: 50 width: 1 color: "red";// "transparent" } ValueAxis { id: axisX min: 0 max: 100 color: "transparent" labelsFont:Qt.font({pointSize: 10}) } ValueAxis { id: axisY min: -300 max: 300 color: "transparent" } LineSeries { id: series1 axisX: axisX axisY: axisY name: "From QML" useOpenGL: chartView.openGL color: "#44D77B" width: 1 pointLabelsColor: "red" } LineSeries { id: series2 axisX: axisX axisY: axisY name: "From QML" useOpenGL: chartView.openGL color: "#44D77B" width: 1 pointLabelsColor: "red" } } } Timer { interval: 50 repeat: true running: true onTriggered: { series1.append( timeStep , myArray[index]); if(index == 400) { index =0; series1.clear(); //series2.clear(); timeStep=0; first = true; timeStep1 = 5; index1 = 5; } //updateRectangle(); print("index : " , index); timeStep+= 1;// 0.25; index++; } } ممنون
-
نگارش 2.0.1
17 دریافت
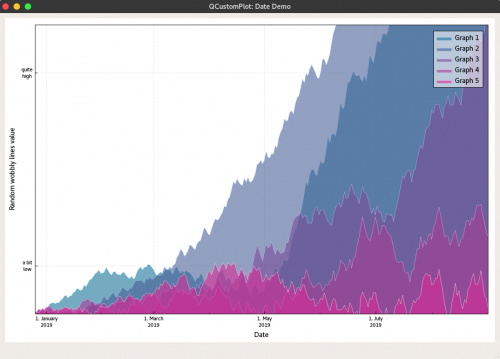
QCustomPlot یک کتابخانه ویجت کیوت سی پلاس پلاس است که هیچ پیشنیاز بیشتری ندارد و به خوبی مستند شده است. این کتابخانه تمرکز بر انتشار گراف و نمودارهای دو بعدی سنگین دارد و با بهرهوری عالی خود انتخاب خوبی برای مجسمسازی بیدرنگ است. نگاهی به آموزش راه اندازی و آموزش مقدماتی نمودار بندازید.رایگان

